
-
- Trading Platforms
- PU Prime App
- PU Copy Trading
- PU Social
-
- Trading Conditions
- Account Types
- Spreads, Costs & Swaps
- Deposits & Withdrawals
- Fee & Charges
- Trading Hours
EN
2 July 2025,02:49
Chart The Market
2 July 2025, 02:49

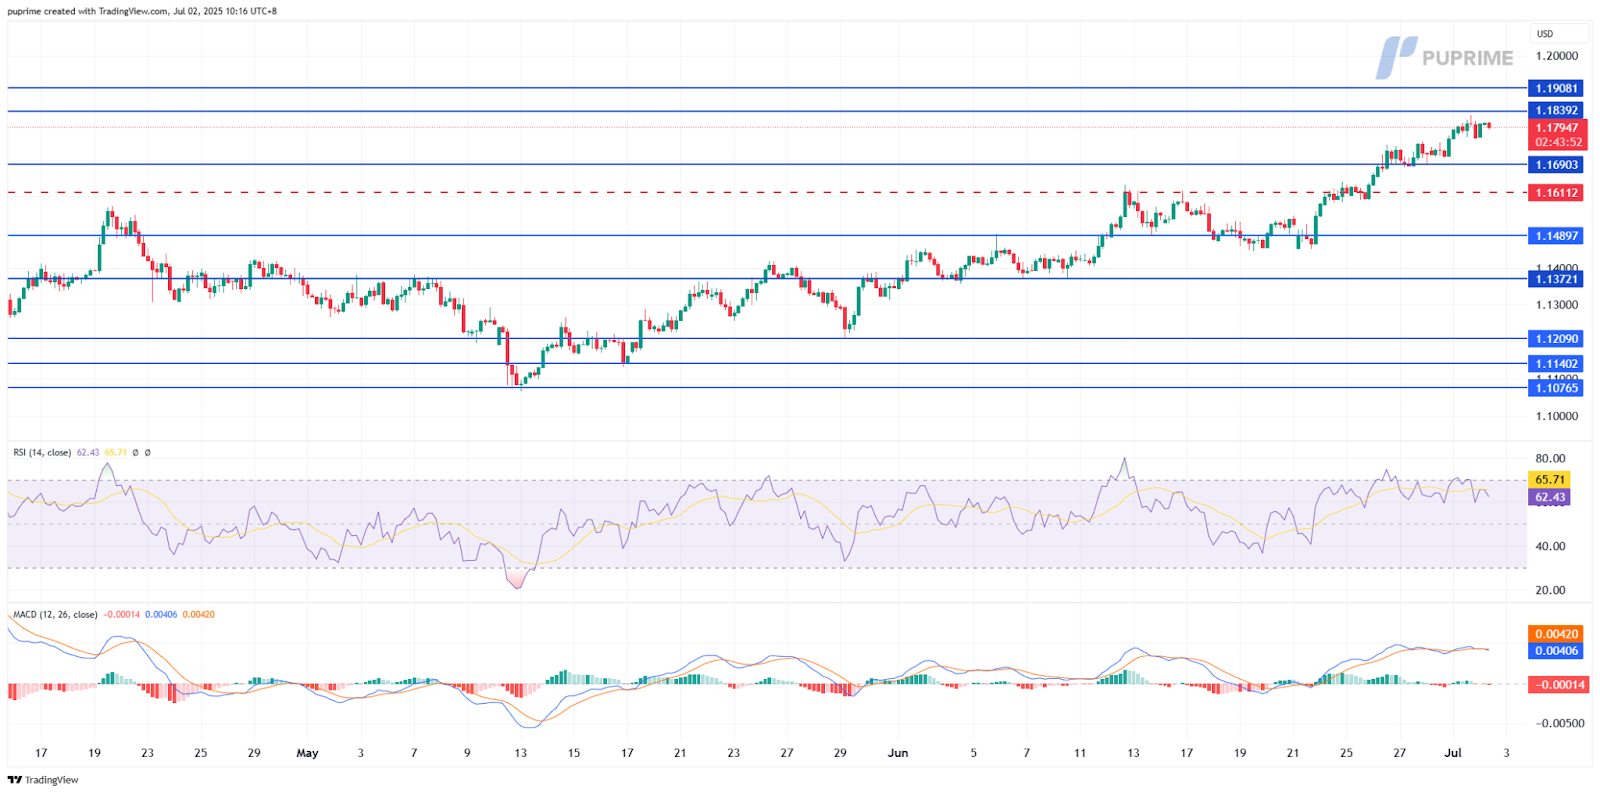
EURUSD, H4:
EUR/USD has pushed higher for a sixth consecutive session, edging toward the key resistance level of 1.1839. The rally follows a clean breakout above 1.1690 support-turned-resistance, supported by a clear series of higher highs and higher lows that reflect a solid short-term uptrend. Price action suggests buyers remain in control—but whether momentum can carry the pair beyond 1.1839 remains to be seen.
That said, momentum indicators are beginning to show signs of strain. The Relative Strength Index (RSI) is hovering near 62—approaching overbought territory. While this does not immediately signal reversal, it warns that bullish momentum may be nearing exhaustion, especially as price approaches a psychological barrier.The MACD remains supportive of the uptrend, with the MACD line comfortably above the signal line and both moving averages still trending upward. However, the histogram has begun to flatten, hinting at slowing upside momentum and a potential pause in the rally.
Volume has also started to thin out during the latest leg higher, suggesting that some buyers may be stepping to the sidelines as the pair nears overextended levels. If EUR/USD fails to break through 1.1839, a pullback toward 1.1690 remains possible. A clean breakout, however, could expose the 1.1908 zone as the next bullish target.
For now, the euro remains in a bullish structure, but momentum divergence and resistance overhead suggest that the next few sessions will be pivotal in determining whether this uptrend has further room to run—or is due for a breather.
Resistance Levels: 1.1839, 1.1908
Support Levels: 1.1690, 1.1610
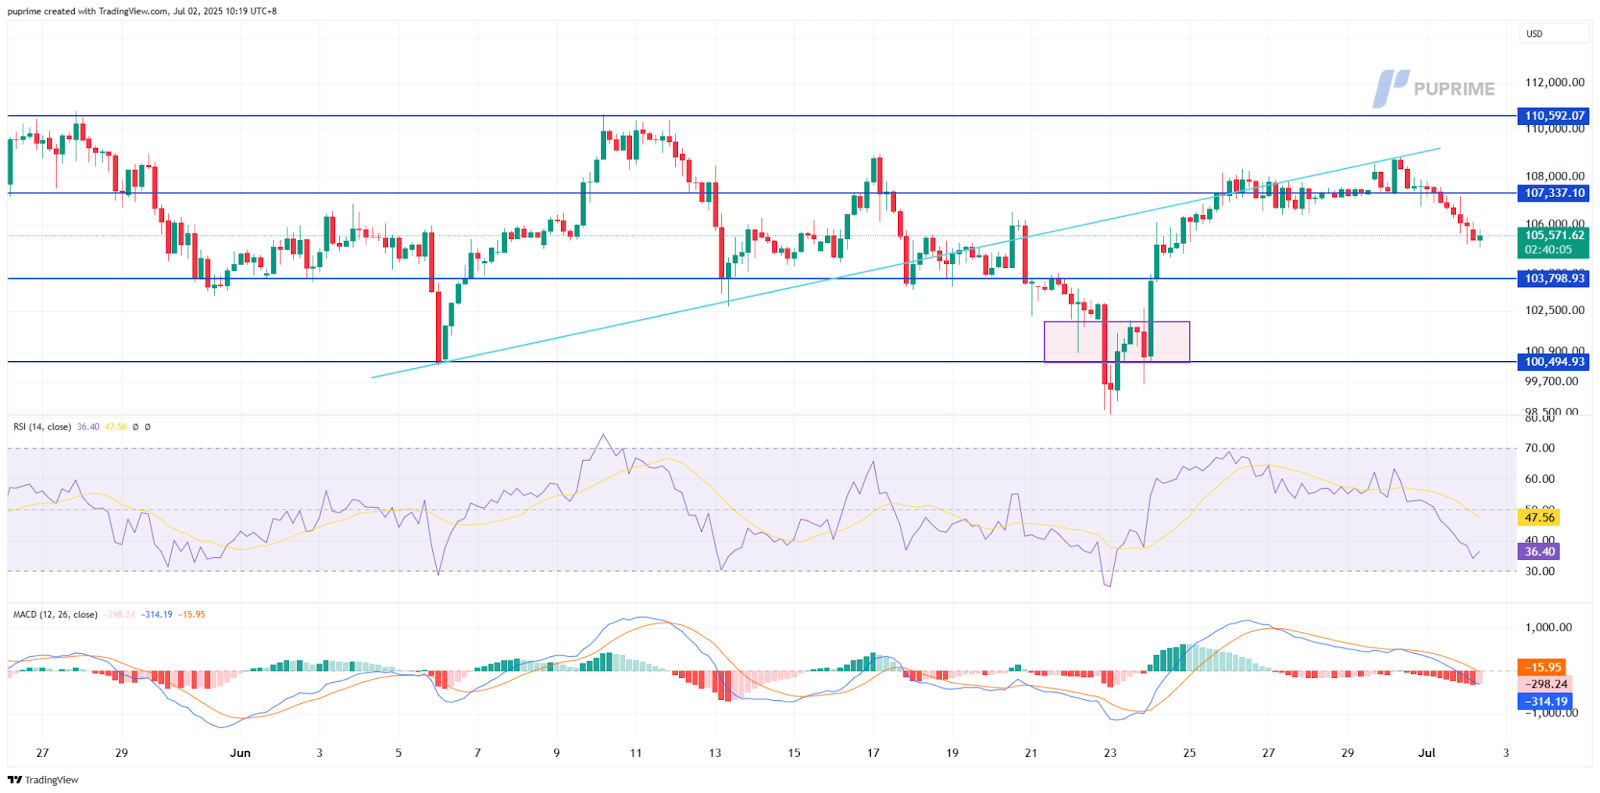
BTC, H4
Bitcoin’s recent rebound has gained traction after decisively reclaiming the $103,000 level, signaling a potential shift in market structure toward bullish momentum. The move followed a strong bounce off the $100,500–$102,000 demand zone, where price formed a short-term double bottom. However, the rally initially supported by a bullish breakout above a short-term ascending trendline, reflecting a temporary shift in sentiment, with early signs of exhaustion beginning to emerge. This area now acts as a pivotal battleground for BTC’s next directional move—a firm breakout above it would validate continued bullish strength, while rejection could open the door to renewed downside.
Technically, momentum indicators paint a mixed picture. The Relative Strength Index (RSI) has rolled over to 36, slipping back below the neutral 50 line and suggesting fading buying interest. While not yet oversold, the RSI’s failure to establish higher highs raises caution that the recent bounce may lack the conviction needed for a sustained move higher.The MACD is turning more cautious. A bearish crossover is now in play, with the MACD line falling further below the signal line and the histogram printing deeper red bars. This confirms a loss of upward momentum and increasing risk of downside continuation if bulls fail to reclaim initiative above the $103,800 zone.
From a structural perspective, $107,337 now serves as a critical pivot—acting as both former support and current resistance. A clean break above this level could reignite bullish sentiment and expose the $110,592 area. However, rejection at this level risks triggering another drop toward $103,798 or even a retest of $100,494—the last major support before broader bearish pressure resumes.
For now, BTC/USD stands at a technical crossroads. While the initial rebound off multi-week lows hinted at recovery potential, waning momentum and resistance overhead suggest bulls have more work to do before regaining full control.
Resistance Levels: 1.3820, 1.3940
Support Levels: 1.3730, 1.3655

Trade forex, indices, metal, and more at industry-low spreads and lightning-fast execution.
Sign up for a PU Prime Live Account with our hassle-free process.
Effortlessly fund your account with a wide range of channels and accepted currencies.
Access hundreds of instruments under market-leading trading conditions.
Trading Platforms
Learn
About PU Prime
Corporate


Please note the Website is intended for individuals residing in jurisdictions where accessing the Website is permitted by law.
Please note that PU Prime and its affiliated entities are neither established nor operating in your home jurisdiction.
By clicking the "Acknowledge" button, you confirm that you are entering this website solely based on your initiative and not as a result of any specific marketing outreach. You wish to obtain information from this website which is provided on reverse solicitation in accordance with the laws of your home jurisdiction.
Thank You for Your Acknowledgement!
Ten en cuenta que el sitio web está destinado a personas que residen en jurisdicciones donde el acceso al sitio web está permitido por la ley.
Ten en cuenta que PU Prime y sus entidades afiliadas no están establecidas ni operan en tu jurisdicción de origen.
Al hacer clic en el botón "Aceptar", confirmas que estás ingresando a este sitio web por tu propia iniciativa y no como resultado de ningún esfuerzo de marketing específico. Deseas obtener información de este sitio web que se proporciona mediante solicitud inversa de acuerdo con las leyes de tu jurisdicción de origen.
Thank You for Your Acknowledgement!